Miyerkules, Oktubre 12, 2016

Lesson XVIII

ROLES AND FUCTIONS OF AN EDUCATIONAL MEDIA CENTER
Image result for ROLES AND FUNCTIONS OF AN EDUCATIONAL MEDIA CENTER

     An EMC is a facility designed for  the housing and utilization of all educational media within the school. It is a basic requirement for a school to render quality service. It is not independent of the school.  Rather, like any part of the human body, it is a unit in the school that cooperates with one another  units or departments that help the school fulfill its mission and realize its  vision by living up to the school’s philosophy and aims. It serves a myriad of roles, among which are: 1. Center of resources, 2. Laboratory for learning, 3. Agent of teaching, 4. Service agency, 5. Coordinating agency, 6. Recreational reading center , and 7. A stepping stone to other resources of the community.
     An EMC renders various kinds of services. It services boil down to improving the teaching – learning process by making it more  interactive, collaborative, interesting and authentic.
     What must an EMC have to be a functional EMC?
     The evaluation questions for  a functional EMC (Lucido & Borabo, 1997) give the following elements.
                 The institutional media services
o   Is the administration committed  to a media program?
o   Is the program of media services administered by a media specialist through media center?
o   Is the center operating  at the same level  as other major institutional services of the school?
o   Are they clearly defined policies, procedures, and plans for short, medium and long term coverage?
o   Is the center provided with appropriate facilities, finances (a regular budget) and staff (both technical  and clerical)?
o   Is the center capable of giving media and / or educational media technology advises/assistance to the faculty? 
Media and instruction
o   Are the faculty encouraged to use media as an integral part of instruction?
o   Are classrooms equipped and/or adapted for the best possible use of educational media?
o   Is the media ce nter accessible to all classrooms and lecture/ conference room?
o   Is there educational media technology information dissemination?
o   Is there proper cooperation between faculty and using media for instructions?
o   In particular, are  faculty members assisted by the media center staff in analyzing teaching needs and in designing, selecting and using educational media to meet these needs?
o   Is there an adequate storage, filing and retrieval/borrowing system for instructional hardware and software/materials?
o   Is the center capable of technical operations relating to technical assistance, equipment repair and cleaning continuous upgrading of facilities?
o   Is there a capability for production of graphics, audio visual and other media materials for instruction?
·                                              Classroom facilities
o   Are classroom designed for and provided with essential facilities foe effective use of educational media?
o   Specifically, are classrooms equipped for full light control, electrical outlets, appropriate ventilation and media operations space?
o   Are classrooms equipped with a bulletin board, chalkboard projection screen, maps, rails, etc. for instruction using media?
·                                               Media program
o   Are there clear-cut administration policies on the media program?
o   Is there an adequate source/system of funding?
o   Is there appropriate hiring of media center supervisions, creating and technical personnel ,consultant and clerical staff?

Lesson XVII

ASSESSMENT IN A CONSTRUCTIVIST, TECHNOLOGY – SUPPORTED LEARNING
Image result for ASSESSMENT IN A CONSTRUCTIVIST, TECHNOLOGY – SUPPORTED LEARNING
From the conversation we gather that some students:
o   Memorizing very much for the test. Fit their style of test preparation to the kind of test and
o   Study only for passing score and a passing grade

`The question we raise are:  “Is it really bad to memorize for the test?”  and  “ Is it not good to study  for  score and for a grade? The answer to both questions is a NO. it is not bad to memorize  for the test. Examines even take in Memory Plus  food supplement to increase their power to memorize. Neither is it bad  to study for scores and grade, however, we should go beyond memorizing for tests and we should not study only for a passing score and a passing grade.
In a constructivist classroom, learning transcend memorization of facts. It is putting these isolated facts together, from concepts and making meaning out of them. It is connecting the integration of these facts and concepts to daily life. It is seeing the relevance of these facts and concepts to what we value and treasure in life. If that is what learning is from the eyes of the constructivists, then definitely, the pure memorization (sometimes without understanding done for a mere recall test does not jibe with such belief.
What then is the assessment practice that will be congruent with the constructivist’s thinking? It is a higher level form of assessment that will require the display of the basic skills of writing and speaking, computing and the more complex  skills of applying  concepts learned, analyzing, critiquing and evaluating, integrating and creating and the social skills of working with call for alternative  forms of assessments. The traditional paper – and – pencil  test will prove to be inadequate to measure basic skills and social skills.
Authentic assessment is most appropriate for the constructivist classroom. ( You will learn more about authentic assessment in your two subjects on assessment.) authentic assessments measures  collective abilities, written and oral expression skills, analytical skills, manipulative skills, (like computer skills) integration, creativity, and ability to work collaboratively.
In authentic assessment, students perform real – world tasks, thus the word “authentic”.  It is an assessment  of a process or a product. That is why authentic assessment  includes performance or product assessment. The performance is a reliable  measure of skills learned and the product is a proof of the acquisition of skills. These performance and product are assessed. Again the mere paper – and – pencil test cannot evaluate these. So what do we need? We need to observe  and evaluate and, to do it more objectively, with the aid of the scoring rubric. ( You will be taught how to make a scoring in rubric in your assessment courses.) for now it may be sufficient  to see a sample of a scoring rubric to get an idea of what it is about and to see its place in assessment.

Lesson XVI

USING THE PROJECT – BASED MULTIMEDIA AS A TEACHING – LEARNING STRATEGY


   Image result for USING THE PROJECT – BASED MULTIMEDIA AS A TEACHING – LEARNING STRATEGY
Goals and objectives are always the starting points of planning. When we plan a multimedia learning project as a teaching stat clarifying our goals and objectives.  From the list of objectives and content found in the K to 12 Curriculum Guide, we select which one will lend themselves to a project –base multimedia learning strategy. Since this strategy requires much time we have to spend as seen against time available or face failure and disappointment afterwards.
          Another  important thing is to determine the resources available from library materials, community resources both material and human, Internet, news media – since this project calls for multimedia. To trim down time devote to a multimedia project, Simkins et al (200) suggest the following:
·         Use technology students already know.
·         Use time outside of class wherever possible. Assign skills practices as homework.
·         Use “special” classes (like art or music) as extra time.
·         Let students compose text and select and prepare graphics and sounds as they plan. Consider the possibility of yours students doing original researches themselves.
·         Let us make clear to our students our policy on decision making and collaboration for smooth working relations.
·         Finally, we must  have a plan on how we are going to evaluate learning.
     So you have decided on the objectives and content with which to use the project-based multimedia strategy and have determined resources available. What are you going to do next. Simkins et al (200) suggest the following:


BEFORE THE PROJECT STARTS

1.  Create project description and milestones. Put in a nutshell what your project is all about. Describe your project in forty (40) words or less. Include your instructional goals and objectives. Include the project components students will be responsible for and their due date. B writing a brief abstract of your project, you have a full grasp of the essence of your project and that your focus will not get derailed.

A milestone may look like this:

Stane
Estimated Time
Before the project starts
2 weeks
Introducing the project
1-2 days
Learning the technology 
1-3 days
Preliminary research and planning
3 days- 3 weeks
                                                  Figure 30. Overview of a Typical Project

2. Work with real –world connection. If you have people outside the classroom involved as clients or assessors (evaluators) work with them to make an appropriate schedule and include their ideas for activities.
3. Prepare resources. Seek the assistance of your librarian or school media

Lesson XV

PROJECT – BASED LEARNING AND MULTIMEDIA
                                             Image result for project based learning and multimedia
A class that effectively employs project-based multimedia learning is highly animated and actively engaged. Together with other students, every student is absorbed in a task in line with the goals and objectives made clear at the start. Time has wings. Time flies so fast that students don’t feel its passing. Teacher does not just stay in front of the class lecturing. She monitors students as they work. Students consult her for guidance and comments. She does not impose her will on students. With her guidance, she allows students to make decisions for themselves. She has more time for those students in need of greater help and attention. By going around, she can sense if students are on the right track and if the goals and expectations set at the start are not set aside but remain to be the governing factor behind every activity. The students’ intellectual power are very much challenged as they read research for basic information and as they analyze and organize from their computer courses and creativity and imagination are demanded when the students produce multimedia presentation by using multimedia produced by others.
Dimensions of Project-Based Multimedia Learning has seven key dimensions
·         Core curriculum
·         Real-world connection,
·         Extended time frame
·         Student decision making
·         Collaboration
·         Assessment
·         Multimedia.
 Simkins (2002) explains each of them briefly:
·Core Curriculum. At the foundation of any unit of this type is a clear setoff learning goal drawn from whatever curriculum or set of standards in use. We use the term core to emphasize that project-based multimedia leaning should address the basic knowledge and skills all students are expected to acquire, and should not simply be an enrichment or extra-credit activity for a special few. Often, these project lend themselves well to multidisciplinary or cross-curricular approaches.
·Real- word connection. The project seeks to connect student” work in school with the wider world in which students live. It is critical that the students-not only the teacher-perceive what is real about the project. The content chosen, the types of activities and the types of products must be real in life.
·Extended time frame. A good project is not a one-shot lesson. It extends over a significant period of time. The actual length of a project may vary with the age of the students and the nature of the project. One project may take days or weeks. Others may take a month or two. It is important that students are given enough time to enable them come up with a substantial final product from which they can derive pride and a clear sense of accomplishment.
·Student decision making. In a protect-based multimedia learning, students have a say. But it is clear to them that the teacher is in charge and so the students understand that there are decisions which only the teacher can make, Student, however, are given considerable leeway n determining what substantive content would be included in their projects as well as process for producing them.
·Collaboration. Protect-based multimedia learning demands collaboration. Collaboration is working together jointly to accomplish a common intellectual purpose in a manner superior to what might have been accomplished working alone. Students may work in pairs or a team as many as five or six. Whole class collaboration are also possible. The goal is for each student involved to make a separate contribution to the final work and for the whole class accomplish greater things than what each individual student can accomplish all alone.
·Assessment. There are tree (3) assessment concerns in protect-based multimedia learning, namely: 1) activities or developing expectations; 2) activities for improving the media products; and 3) activities for compiling and disseminating evidences of learning. Students must be clarified on what is expected of them and on how they will be assessed. In project-based multimedia learning, they are expected to show evidence that they gained content information, became better team members, could solve problems and could make choices (for instance on what new information they would show in their presentation). Students are also expected to assess their own media products so they can improve on them.
·Multimedia. In multimedia projects, students do not learn simply by “using” multimedia produced by others; they learn by creating it themselves. The development of such programs as HyperStudio, Kid Pix, and Netscape Composer has made it possible for students of all ages to become the authors of multimedia content. As students design and research their projects, instead gathering only of written notes, they also gather-and create-pictures, video clips, recordings and other media objects that will later serve as the raw material for their final product. The black plague project was exemplary in terms of the seven (7) dimensions given in the foregoing paragraphs. It addressed the standard set by the Department of Education trough the K to 12 Basic Education Curriculum in social studies, and science. The real world connection to the AIDS Epidemic made the project relevant to students. The project extended over many weeks, and students were allowed to choose perspectives and make decisions about the design and interface for their presentations. Students collaborated in small groups to research and implement each perspective in the presentation. Assessment was on-going and multifaceted. Students’ presentations included in the variety of media: text, original art work, scanned images and animations. (Adapted from Simkins, 2002) Why use project-based multimedia Learning? Because it is “value added” to your teaching. It is powerful motivator as proven in the classes of Teacher Nachielle and teacher Nicole described earlier in this lesson. It actively engages students in the learning task. Students are likewise engaged in the production of multimedia presentation. What can be some limitations of the use of project-based multimedia learning strategy? One limitation that we see in the need for the extended period of time. You need time to orient the students on what bare expected of them, guidelines, goals and objectives of the project, and more so for the students together and organize their data, work on their presentations and the like. this strategy requires technical skills on your part of your students. Remember, they will be using a combination of several media, which includes, of course, the computer, if the basic computer courses did not teach them these skills demanded by this strategy, there will be a problem. To address this problem, some days need to be devoted to learning the technology. This can be another limitation. A third limitation can be the tendency to lose track of the goals and objectives of your lesson because the technology aspect has gotten the limelight. You may get so occupied learning the multimedia presentation that your lesson objectives get derailed and your project ends up as mere technology lesson. So, you have to be sure that the technology aspect of your lesson does not eclipse the academic content which is the core of your lesson and therefore is most important.

Lesson XIV

MAXIMIZING THE USE OF OVERHEAD PROJECTOR AND THE CHALKBOARD

                                           Image result for maximizing the use of the overhead projector and the chalkboard

Except in extremely deprived classrooms, every classroom has a chalkboard. In fact, a school may have no computer, radio, tv, etc. but it will always have a chalkboard. so why not make optimum use of what we have, the chalkboard? The following practices of dedicated professional teachers may help us in the effective use of the chalkboard:
         Write clearly and legibly on the board. Take note that there are children in the last rows.
         It helps if you have a hard copy of your chalkboard diagram or out line. That helps you to visualize the diagram or outline you like to appear on the chalkboard. That clean diagram and organized outline must match what you do on the chalkboard.
         Don't crowd your notes on the board. By overcrowding your board work, your students may fail to see the key ideas. They may not see the trees because of the forest. 3
         Make use of colored chalk to highly the key points. Color will also make your board more appealing. I witnessed one good teacher who had no other visual aid except herself, the chalkboard and her colored chalks.
         Do not turn your back to your class while you write on the chalkboard. Write side view as you talk. Don't lose your eye contact with your class.
         For the sake of order and clarity, start to write from the left side of the board going right.
         If you teach the grades and you think the lines on the chalkboard are needed for writing exercise, then provide the lines for your board.
         Look at your board work from all corners of the room to test if pupils from all sides of the room can read your board work.
         If there is glare on the chalkboard at certain times of the day, a curtain on the window may solve the problem.
         If you need to replace your chalkboard or if you are having a new classroom with new chalkboard suggest to the carpenter to mount the chalkboard a little concave from left to right to avoid glare for the pupil's benefit.
         If you need to have a board work in advance or that need to be saved for tomorrow's use (say a quiz or a sophisticated diagram), write “ place save” and cover the same with a curtain.
         Make full use of the chalkboard. It may be a traditional educational technology but it serves its purpose very well when used correctly.
Here are some more chalkboard techniques, from James W. Bown (1969).
Chalkboard
A. Sharpen your chalk to get good line quality.
 B. Stand with your elbow high. Move along as you write.
C. Use dots as “aiming points.” this keeps writing level.
D. Make all writing or printing between 2 and 4 inches high for legibility.
E. When using colored chalk, use soft chalk so that it can be erased easily.
The over head projector (OHP)
There are other kinds of projectors like opaque projector and slide projector. The overhead projector seems more available in schools. It has a lot of advantages. Brown (1969) cites the following:
·         The projector itself is simple to operate..
·         The overhead projector is used in the front of the room by the instructor, who has complete control of the sequence, timing and manipulation of his material.
·         Facing his class and observing student reactions, the instructor can guide his audience, control its attention, and regulate the flow of information in the presentation.
·         The projected image behind the instructor can be as large as necessary for all in the audience to see; it is clear and bright, even in fairly well-lighted rooms.
·         Since the transparency, as it is placed on the projector, is seen by the instructor exactly as students see it on the screen, he may point, write, or otherwise make indications upon it to facilitate communication.
·         The stage (projection surface) of the projector is large (10 by 10 inches), thus allowing the teacher to write information with ease or to show prepared transparencies. His/her work appears immediately on the screen.
·         It is especially easy fro teachers and students to create their own materials for use in the overhead projector.
·         There is an increasing number of high-quality commercial transparencies.
Let's learn how to use it properly so we also maximize its use in the classroom. Brown (1969) gives us several techniques:
Overhead Projection Techniques
Among the outstanding attributes of overhead projection are the many techniques that can be used to present information and control the sequence of a presentation. As you plan your own transparencies, keep in mind these figures of overhead projection:
·         You can show pictures and diagram, using a pointer on the transparency to direct attention to a detail. The silhouette of you pointer will show in motion on the screen.
·         You can use felt pen or wax-based pencil to add details or to make points on the transparency during projection. The marks of water-based pens and pencil can be removed with a soft cloth so that the transparency can be reused.
·         You can control the rate of presenting information by covering a transparency with a sheet of paper or cardboard (opaque material) and then exposing data as you are ready to discuss each point. This is known as the progressive disclosure technique.
·         You can superimpose additional transparency sheets as overlays on a base transparency so as to separate processes and complex ideas into elements and present them in step-by-step order.
·         You can show three-dimensional objects from the stage of the projector-- in silhouette if the object is opaque, or in color if an object is made of transparent color plastic.
·         You can move overlays back and forth cross the base in order to rearrange elements of diagrams or problems.
·         For special purposes you can stimulate motion on parts of a transparency by using the effects of polarized light. To do this, set a plaroid glass spinner over the projector lens and attach a special plastic element of parts of the transparency for which motion is desired.
·         You can simultaneously project on an adjacent screen other visual materials, usually slides or motion pictures, which illustrate or apply the generalizations shown on a transparency.
Other reminds on the effective use of the OHP are:
·         Stand off to one side of the OHP while you face the students.
·         Don't talk to the screen. Face the students when you talk, no the screen.
·         Place the OHP to your right, if you are right handed, and to your left, if you are left handed.
·         Place the OHP on a table low enough so that it does not block you or the screen.
·         Have the top of the screen titled forward towards the OHP to prevent the “keystobe effect” (where the top of the screen is larger than the bottom).
·         Avoid the mistake of including too much detail on each image. A simple layout makes an effective slide. If an audience needs to be give details, provide handouts to be studied later.
·         Avoid large tables of figures. Come up with graphic presentation.
·         Don't read the text on your slide. Your audience can read.
·         Avoid too much text. Rely sparingly on printed text. Come up with more graphs, charts,diagrams or pictures.
·         Your presentation must be readable from afar. Simple use of color can add effective emphasis..
We can learn from the experiences from other, Brown (1969) enumerates effective practices. Let's learn from them.
·         In primary grades, simple objects like keys, leaves, and cutout paper shapes can be placed directly on the projector to stimulate children's imagination and encourage discussion.
·         In English composition lessons, student themes or writing exercises can be reproduced on film by means of the heat or photocopy process. The teacher and students can analyze the writing for style and grammar as each example is projected.
·         In arithmetic, blank sheets of acetate and grease pencils can be given to selected students. Have them prepare solutions to homework problems so the class may evaluate and discuss their results.
·         In geometry and trigonometry, two- and three-dimensional diagrams can be built up gradually with carefully prepared transparencies involving color and separate overlays. Geometric theorems and complicated problems can be separated into single components and presented systematically. In other mathematical and technical subjects, plastics objects like some rulers and composes can be shown to a group and discussed.
·         In physical educational and team training, plays and game procedures may be analyzes through the use of plastic or opaque moving symbols on a transparency which shows the court or field design.
·         In homeroom activities, the secretary can use a cellophane role (accompanying most projectors) or blank acetate sheets in write nominations, lists, motion for consideration, and important discussion points for all to see and react to.
·         In primary reading class, a picture-transfer transparency can be made from a magazine picture. Project this transparency and task t6he class to identify major items shown. Then place a clear piece of acetate over the picture and, with a felt pen, write the name of each item identified. Later remove the picture and discuss the words that remain on the screen.
·         In art classes, a teacher can sketch on clear plastic with a felt pen. The entire class sees the results. Similarly, transparent watercolors, colored plastic shapes, finger paint, inks, or grease pencil may be used.
·         In science, iron filings dusted on a clear plastic sheet over a permanent magnet can be projected clearly to illustrate lines of force. Leaves, with chlorophyll removed, can be projected to show veins and the general leaf pattern. Clear glass petri dish can be placed on the projection platform and used to show chemical reactions when changing colors reveal interactions of translucent fluids.
·         In social studies, all types of maps can be enlarged after accurate but easy preparation. Overlays show key facts about particular regions.
In many classes, testing and evaluation materials can be used with a large group. Test items written on slides can be projected for the entire class. the “progressive disclosure” technique mentioned previously can be achieve by (1) placing a sheet of paper over the transparency and moving it down to expose succeeding lines of type, (2) attaching strips of opaque paper to the slides of the mask in order to cover potions of the transparency image, and the flipping the strips back to expose image, (3) placing over the transparency an opaque sheet containing a cutout slit which exposes lines or copy are in sequential order as it is moved down or across the copy.
The overlaying technique to do progressive disclosure is illustrated below.
·         Prepare a master drawing for each separate part.
·         ·After making a sketch of the content of the transparency, decide which parts will be the base and which will be used for each overlay.
·         In two corners on each master, make register marks that match marks previously put on the sketch. This will ensure proper registration of each overlay.
·         Prepare the transparency from each master. ·Mount each transparent sheet: base under the frame, and overlays on the top sides. Use the register marks for proper alignment.

Lesson XIII

TEACHING WITH VISUAL SYMBOLS
  

Your experience of the words and the graphs convinces you that a graph is easier to understand than the words of a paragraph. A graph is “worth a thousand words.” a graph and any visual symbol for that matter such as drawings, cartoons, strip drawings, diagrams and maps are worth a thousand words. They are more clearly understood than mere words. Let us learn more about each of them and find out where they can be used in our lessons.


A. Drawings


A drawing may not be real thing but better to have a concrete visual aids than nothing. To avoid confusion, it is good that our drawing correctly represents the real thing. One essential skills that a teacher ought to possess at order to be understood is drawing. It helps you a lot if you are capable of doing simple freehand sketching. You will find out that as you lecture, you need to illustrate on the chalkboard. So, better start learning how to draw. The only way to learn it is to do the sketching yourself and devote some time to it. There is nothing so difficult that is not made easy when we spend at least forty hours learning and mastering it.


B. Cartoons

Another useful visual symbols that can bring novelty to our teaching is the cartoon. A first-rate cartoon tells its story metaphorically. The perfect cartoon needs no caption. The less the artist depends on words, the more effective the symbolism. The symbolism conveys the message.
Sources of cartoons
You can easily collect cartoons for instruction. They appear often in newspapers and magazines. In class, you can give it to individual students for individual study or project it by an opaque projector. Depending on themes for the week of the month, you can display these cartoons on the bulletin board. One creative teacher arranged for a “ cartoon of the month” and displayed and changed her display every end of the month.
Where to use cartoons in instruction
you can also use this as a springboard for a lesson or a concluding activity. It depends on your purpose.
K to 12 curriculum standards and competencies
go back to the K to 12 curriculum guide. Which can be taught with the use of a cartoon? Come up with a cartoon for a particular lesson.

C.Strip drawing
These are commonly called comics or comic strip. Dale (1969) asserts that a more accurate term is strip drawings. Make use of strip that are educational and entertaining at the same time.
Where to use strip drawing in instruction
these can serve as motivation and a starter of your lesson. It can also be given as an activity for students to express insightss gained at the conclusion of a lesson.
Source of strip drawing
you can obtain strip drawings from newspapers, magazines and books
K to 12 curriculum standards and competencies
identify a competency where a strip drawing is appropriate. Look for an appropriate strip drawing or make one.
D. diagram

What is a diagram? It is “ any line drawing that shows arrangement and relations as of parts to the whole, relative values, origins and development, chronological fluctuations, distribution etc.” (Dale, 1969)
If you can draw stick figures, you can easily draw the diagrams that you need as you go along. To emphasize the key points in your diagram, make use of color whether you use the chalkboard of the OHP and transparenicies.
types of a diagram
Find out what these other diagrams are. You may nedd them as you teach and as you go about you other teaching-related tasks.
·         Affinity diagram- used to cluster complex apparently unrelated data into natural and meaningful groups.
·        

 Tre diagram- used to chart out, in increasing detail, the various tasks that must be accomplished to complete a project or achieve a specific objective.
·        
 Fishbone diagram- it is also called cause and effect diagram.it is a structured form of brainstorming that graphically shows the relationship of possible cause and sub -causes directly related to an identified effect / problem. It is most commonly used to analyze work-related problems.
E. Chart
A chart is a diagrammatical representation of relationships among individuals within an organization. We can have a: 1.) time chart, 2.) tree or stream chart, 3.) flow chart, 4.) organizational chart, 5.) comparison and contrasts chart, 6.) pareto chart and 7.) run chart or trend chart.
Examples of chart
·         Time chart- is a tabular time chart that presents data in ordinal sequence.
Image result for time chart
·         Tree or stream chart- depects development, growth and change by beginning with a single course (the trunk) which spreads out into many branches; or by beginning with the many tributaries which then converge into a single channel.
Image result for tree or stream chart
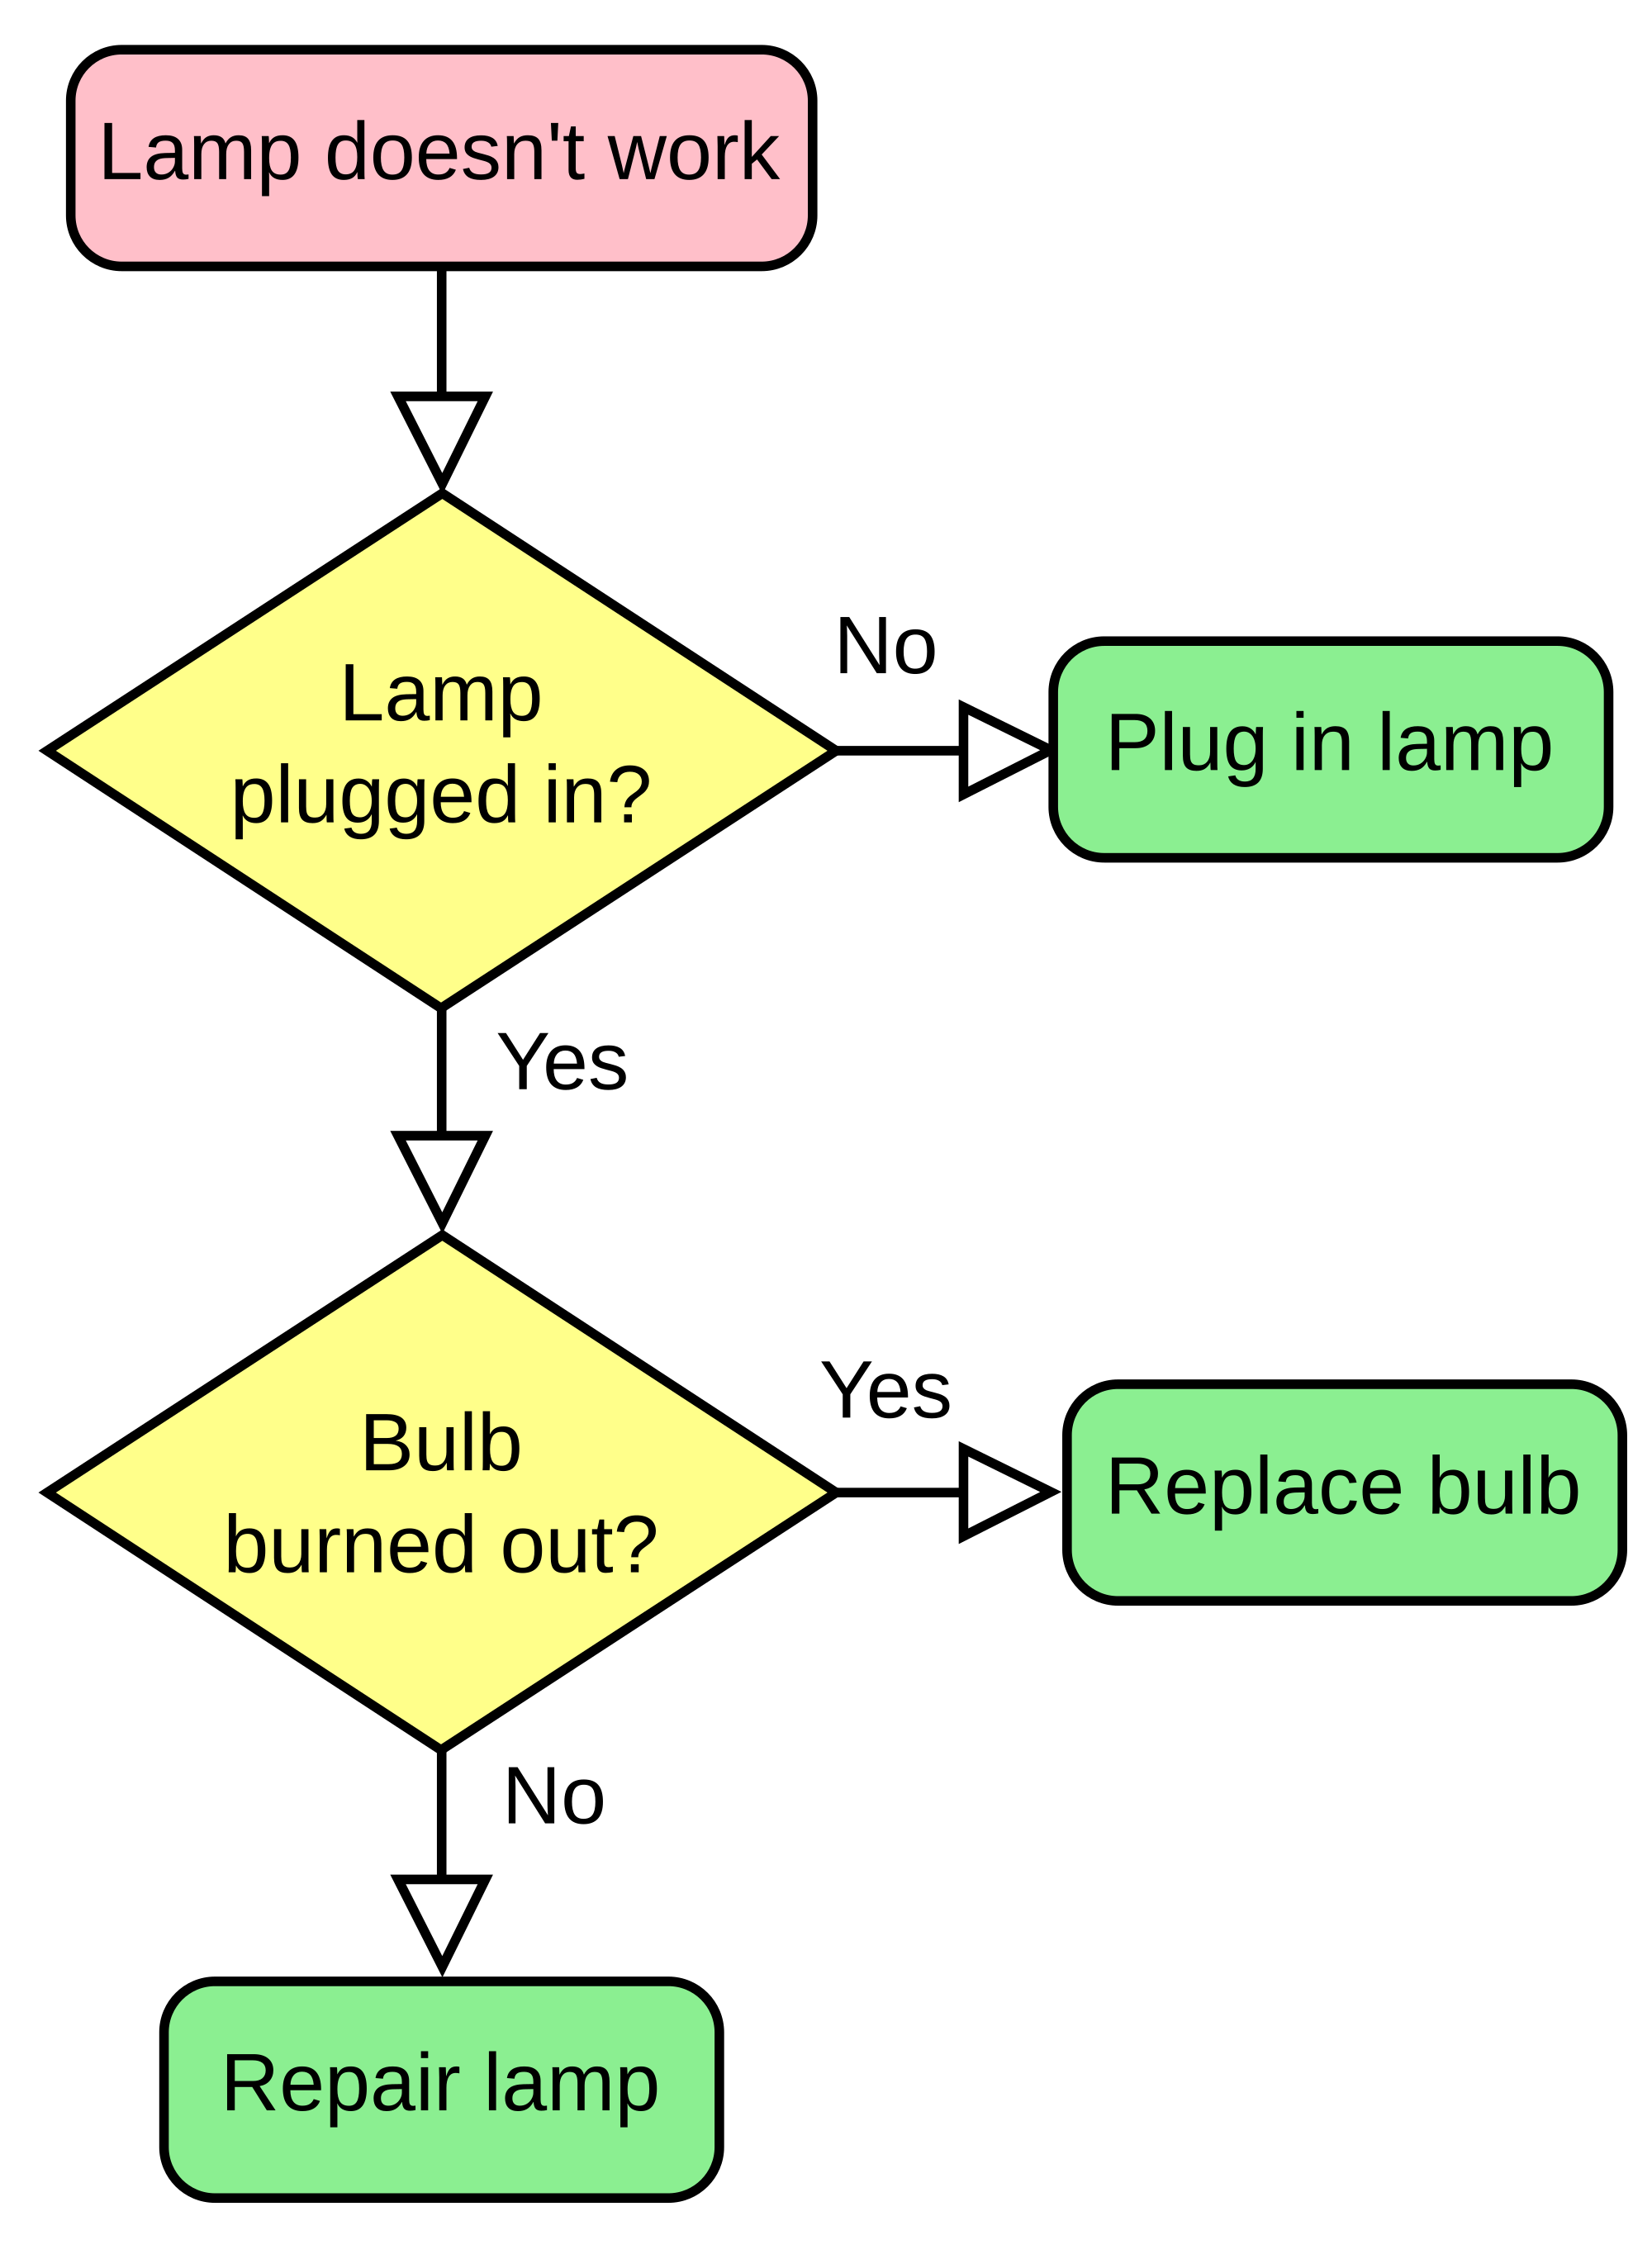
·         Flow chart- is a visual way of charting or showing a process from beginning to end. It is a means of analyzing a process. By outlining every step in a process, you can begin to find ineffeciencies or problems. (Latta, 1994)
Image result for flow chart
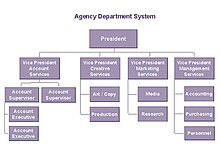
·         Organizational chart- shows how one part of the organizational relates to other parts of the organizationa.
Image result for organizational chart
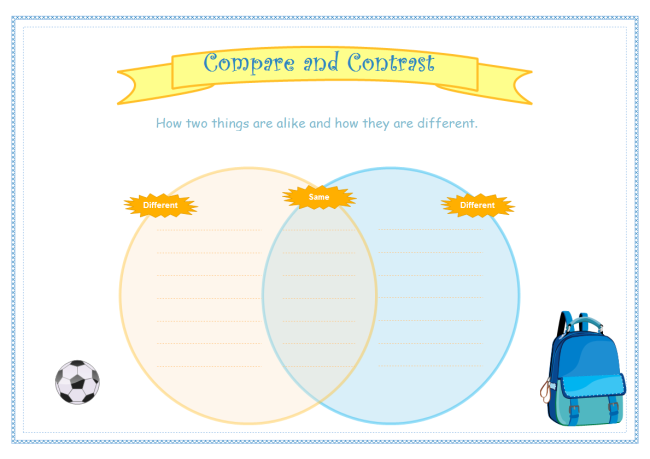
·         Comparison and contrasts- used to show similarities and differences between two things (people, places, events, ideas, etc.)·
Image result for comparison and contrast chart
·         Pareto chart- is a type of bar chart, priorritized in descending order of magnitude or importance from left to right. It shows at a glance which factors are occuting most.
Image result for pareto chart

K to 12 standards and competencies
Find out which of these charts are appropriate for any lesson in the K to 12 curriculum guide or for any teaching related tasks.
F. graphs
These are several types of graphs. They are :1.) circle or pie graph, 2.) bar graph, 3.) pictorial graph and 4.) line graph.
·         Pie or cicle graph- recommended for showing parts of whole.
Image result for pie graph
·         Bar graph- used in comparing the magintude of similar items at different ties or seeing relative sizes of the parts of a whole.
                                          Image result for bar graph
·         Pictorial graph- makes use of picture symbols.
                                             Image result for pictorial graph
·         Graphic organizers- you met several graphic organizers in your subject, principles of teaching.
                                                     Image result for graphic organizer
G. Maps
A maps is a “representation of the surface of the earth or some part of it...” (Dale 1969)
kinds of map
·         physical map- combines in a single projection data like altitude, temperature, rainfalll, precipitation, vegetation, and soil.


·         Relief map- has three dimensional representations and shows contours of the physical data of the earth or part of the earth.
                                           Image result for relief map

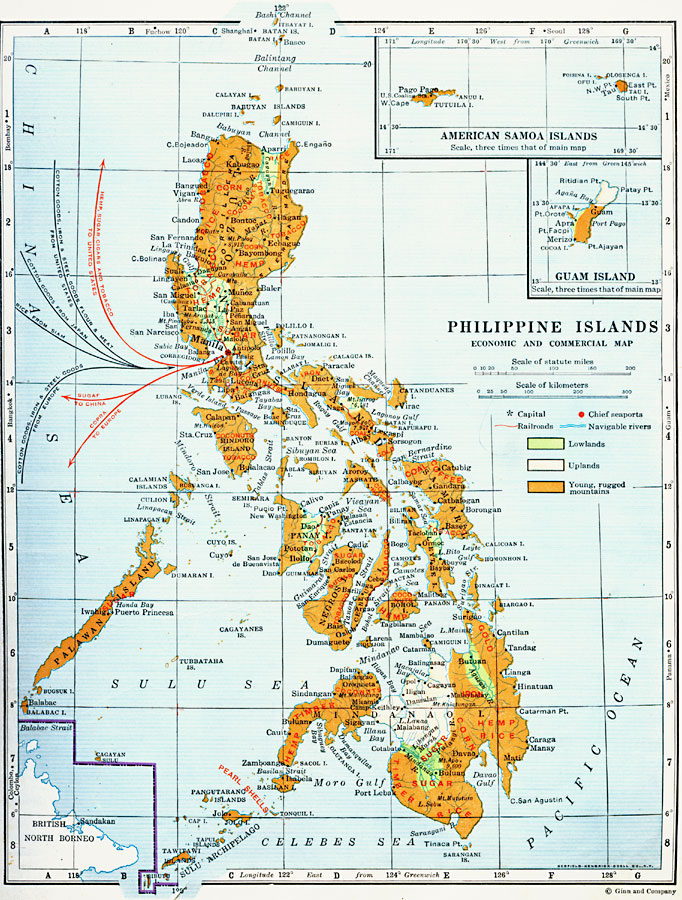
·         Commercial or economic map- also called product or industrial map since they show land areas in relation to the economy.
                                                       Economic and Commercial Activity in the Philippine Islands
·         Political map- gives detailed information about country, provinces, cities and towns and roads ang highways. Oceans, rivers and lake are the main features of most political maps.
                                                Image result for political map
Map language
·         Scale- shows how much of the actual earth's surface is presented by a given measurement on a map. The scale musr be shown so that the map reader can use the distances and areas shown on the map in measuring or figuring out the real distance and areas on the earth's surface. On some maps, scale is shown graphically. In others the scale is expressed in words and figure.e.g. 1 inch – 15 statute miles. 3
·         Symbols- usually a map has a legend that explains what each symbols means. Some symbols represent highways, railroads, mountains, lake and plains.
·         Color- the different colors of the map are parts of the map language.
·         Geographic grids- the entire system of these grid lines. These grid lines are called meridians and parallels. A meridians is a north to south pole line. Parallels are lines drawn around a globe with all points along each line with an equal distance from the pole. Longitude is the distance in degree of any place east or west of the prime meridians. Latitude is the distance in degrees of any place north and south of the equator.
Map reading test
Here is a map reading test. Test your self. Don't you worry, if you don't perform well at first. After further reading about maps, take the test again. Do it until you get a perfect score. If you work hard at it, you will not be hard up presenting or teaching your students about maps later.
A map-reading test
A number of studies have been made of the ability of pupils to read maps and, in general, the findings are disappointing. Many students have not mastered simple map-reading skills before they leave junior high school. Further, studies show that geographical errors common to pupils are also common among teachers. Encircle the T if the statement is correct and F if the statement is wrong (adapted from audiovisual methods in teaching, by Edgar dale, (1969)
lines of longitude are parallel to each other. T F · on a globe all lines of latitude meet at the poles. T F · a degree of longitude ranges from 68.4 to 69.4 miles. T F · longitude is usually measured from greenwich, England. T F · latitude is measured from the equator. T F · the latitude of the poles isa 90 degrees. T F · the hours of daylight in summer and winter are related to longitude. T F · places at low latitudes usually have warm climates. T F · time belts are directly related to longitude. T F · the latitude of a place indicates its distance from the equator. T F · the highest latitudes are around the poles. T F · a place not on the equator must be either north or south of it. T F · lines of longitude bisect the earth. T F · latitude means angular distance north or south of the equator. T F · longitude 0 degree defines an exact place on the earth. T F · lines if latitude are parallel to the equator. T F · latitude 90 degree north define an exact place on the earth. T F · any place not on the Greenwich Meridian is either east or west of it. T F · a place of 40 degree latitudes is about 1,000.3,000,5,0000,8,000 miles from the T F equator · a line of longitude is also called a meridian. T F · the longitude of a place gives a rough indication of its climate T F · a line of latitude is referred to as a parallel. T Funderstand the maps, graphs and charts.